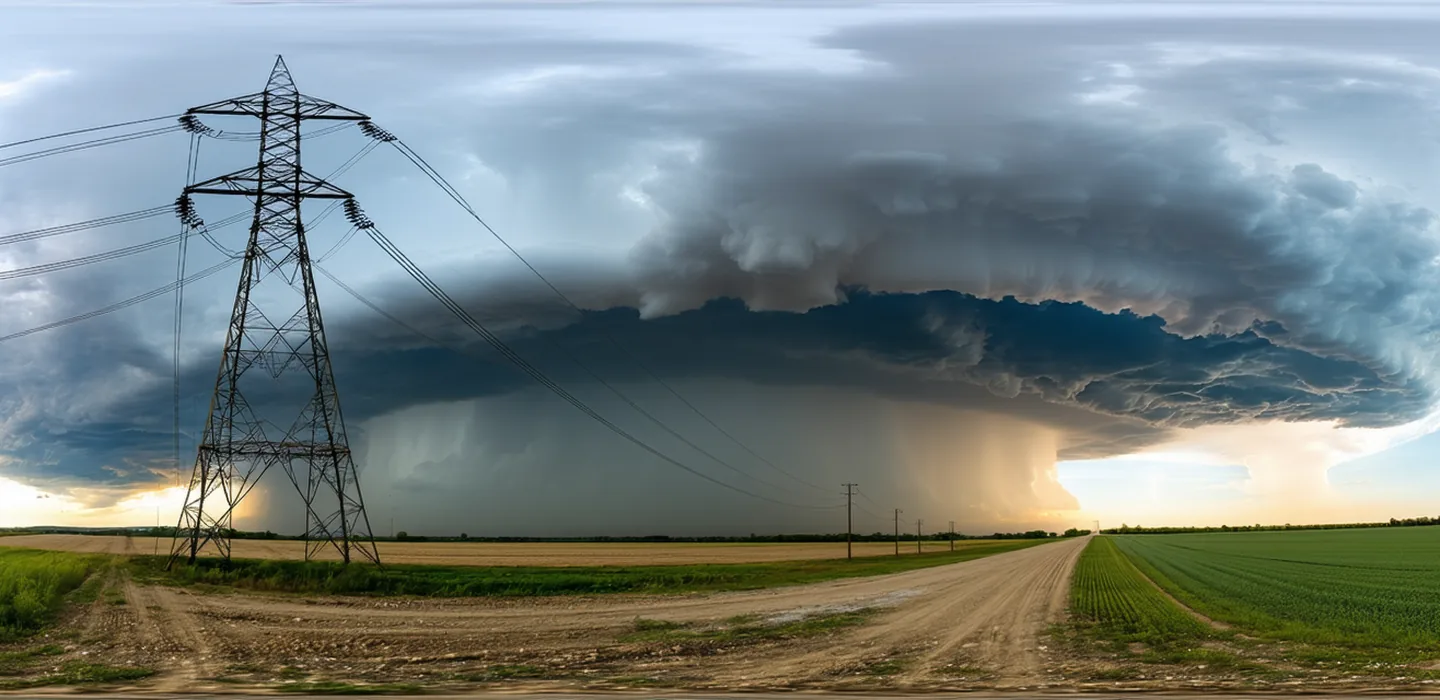
Power transmission lines and towers against a threatening storm sky

Infrastructure Coverage

When wind exceeds design limits, your coverage should respond.

Energy, transportation, and utility assets exposed to climate extremes. Wind speed, heat index, and flood triggers that pay automatically when instruments confirm exceedance.

Bft 10
Beaufort storm threshold
55+ mph
Sustained wind trigger
72 hrs
Payout on trigger

Infrastructure trigger metrics.

Select triggers are calibrated to design-limit exceedance — the wind speed or load level at which structural engineering standards indicate elevated damage probability for your asset class. All thresholds reference NOAA ASOS automated instrument records, not modeled estimates.

Max Sustained Wind Speed — mph
Threshold range: 45–74 mph | Typical: 55 mph (Bft 10)

Maximum 1-minute sustained wind speed at the reference NOAA ASOS station. Triggers when sustained speed exceeds the agreed threshold during the coverage period. Beaufort Scale equivalents provided for intuitive reference. Most relevant for transmission infrastructure and above-ground assets.

Payout: Binary at threshold, or linear scale above 55 mph
Wind speed distribution
3-Second Gust — mph
Threshold range: 65–90 mph | Typical: 74 mph (Bft 12)

Peak 3-second gust speed from NOAA ASOS automated surface observing systems. More sensitive trigger for assets with structural vulnerability to brief peak loads — solar panel arrays, communication towers, and light structural elements where instantaneous peak wind matters more than sustained speed.

Payout: Binary at gust threshold
Gust speed distribution
Cooling Degree Days — Excess
Threshold: 20–35% above normal CDD | Typical: 25% excess

Cumulative measure of cooling energy demand. CDD excess triggers protect utility and power generation assets against sustained extreme heat that drives simultaneous peak demand, grid stress, and equipment thermal operating limit exceedance. Relevant for transmission operators and power plant operators.

Payout: Proportional to CDD excess above threshold
CDD seasonal accumulation
Flash Flood Guidance Index
Threshold: Hourly rainfall exceeding NWS Flash Flood Guidance

National Weather Service Flash Flood Guidance values represent the amount of rainfall over a given duration needed to produce flooding at a specific point. When observed precipitation exceeds FFG for the reference watershed, trigger activates. Most relevant for stormwater infrastructure, road networks, and underground utility conduits.

Payout: Binary at NWS FFG threshold exceedance
Hourly rainfall rate

Infrastructure asset types covered.

Energy
Generation and transmission.
Solar PV farms Wind generation assets High-voltage transmission lines Substations Natural gas peaker plants
Primary triggers: Wind speed, CDD excess / Year-round coverage available
Transportation
Roads, bridges, and rail.
Highway and roadway networks Bridges and overpasses Rail corridors Port infrastructure
Primary triggers: Wind gust, flash flood, ice accum. / Hurricane season focus
Utilities
Water, stormwater, and telecom.
Water treatment facilities Stormwater systems Wastewater infrastructure Telecom towers
Primary triggers: Flash flood guidance, wind speed / All-season coverage

Coverage scenario: Southeast solar farm, hurricane-adjacent wind event.

Asset type 65 MW Solar PV farm
Coverage period June 1 – November 30, 2024
Reference station NOAA ASOS KSAV
Savannah, GA
Trigger threshold Max sustained wind ≥ 55 mph
OR 3-sec gust ≥ 74 mph
Trigger event September 28, 2024
Max sustained: 62 mph
Peak gust: 81 mph
Settlement Wire initiated September 30
(44 hours post-event)

Wind Speed — 48-Hour Event Window

80+ 65 55 30 0 0h 12h 24h 36h 48h Trigger

Synthetic scenario for illustration.

Infrastructure coverage FAQ.

We currently underwrite infrastructure assets in the continental United States, with particular depth in the Southeast (hurricane and heat exposure) and Great Plains (wind and hail exposure). Coverage decisions depend on available NOAA ASOS station density within 30 miles of your asset — contact us to confirm coverage availability for your specific location.
Yes. Parametric coverage is a standalone financial instrument, not a property indemnity policy. It does not require coordination with your primary property insurer. The payment represents a contracted financial transfer based on index crossing — distinct from property damage assessment under a traditional policy. The two products can complement each other.
Station proximity is a key design factor. We reference the nearest NOAA ASOS station with continuous automated records, typically within 15–25 miles of your asset. Where station distance introduces meaningful basis risk, we use multi-station weighted averages or require a confirming secondary station. This is negotiated at binding.
The policy specifies a settlement timing convention: trigger determination occurs 24 hours after the end of the coverage event window, allowing for NOAA's standard publication delay. In the unlikely event of extended data unavailability from the primary station, the policy specifies backup station protocol or NOAA's provisional data publication as the fallback.
Yes. Riskwright's policies are backed by panel reinsurers. Specific reinsurance structure and capacity details are available to qualified prospective policyholders during the underwriting engagement. We operate within defined per-event and aggregate exposure limits designed to ensure full settlement capacity across our current book of business. Coverage proposals include the applicable per-event limit for your policy.

Coverage that responds at the speed of weather.

Describe your asset type, location, and primary weather exposure. Our underwriting team will outline trigger options within 2 business days.